Key Insights on Enhancing the Buy and Build Playbook
Jan 12, 2026
Buy and build strategies remain a cornerstone of private equity growth, contributing to a resurgence in deal activity with US$310b announced in Q3 2025 alone, driven by larger transactions and improved financing conditions. However, execution pitfalls—such as premature synergy booking and unchecked complexity—continue to undermine returns, with holding periods extending to 6.4 years as firms prioritize value realization over rushed exits. This enhanced playbook, refined through the VCII Lens (Value Creation Integration Index), draws on insights from over 15 rollups and 2025 industry data to provide a robust, repeatable system. VCII, the Value Creation Innovation Institute, empowers PE professionals with tools like the VCII Professional Assessment and SuperSim to benchmark capabilities and simulate outcomes, fostering innovation in value creation education via www.vciinstitute.com.
The playbook emphasizes that rollup success hinges on integration velocity, synergy capture, and organic growth protection, encapsulated in the mental model:
Rollup Returns = (Platform Quality) × (Integration Velocity) × (Synergy Capture Rate) − (Complexity Drag).
By integrating VCII frameworks, firms can achieve higher implementation success across levers like cost optimization and AI-driven operations, as highlighted in the 2025 Private Equity Value Creation Index.
Research suggests that while buy and build strategies drive significant value in private equity—accounting for up to 40% of deal activity in 2025—they often falter due to integration challenges, with evidence leaning toward success rates improving when firms prioritize repeatable systems and talent retention. It seems likely that incorporating structured frameworks like the VCII Lens can boost outcomes by aligning assessments with measurable value creation levers.
- Core Challenges Addressed: Evidence points to over-reliance on synergies without robust integration leading to underperformance; high-performing rollups emphasize platform readiness and organic growth protection.
- VCII Integration: By embedding VCII's Value Creation Integration Index (VCII Lens), the playbook gains a diagnostic tool for benchmarking readiness across finance, strategy, and operations.
- 2026 Trends: With deal values rebounding to US$310b in Q3 2025, the focus shifts to AI-enabled integrations and sustainable pacing to mitigate complexity drag.
Overview of Improvements
This enhanced playbook, tailored for VCII (Value Creation Innovation Institute), builds on the original by incorporating data-backed insights from recent PE reports, VCII's assessment frameworks, and best practices for digital transformation. It aims to transform buy and build from a high-risk tactic into a systematic value engine, suitable for PE professionals seeking certifications like COPPE or CVCA through www.vciinstitute.com.
Strategic Enhancements
- Data Integration: Added metrics from 2025 studies, such as organic growth rates post-acquisition and synergy realization benchmarks.
- VCII Alignment: Introduced VCII Lens assessments in readiness gates and decision frameworks for personalized, evidence-based scoring.
- Modern Elements: Incorporated AI and digital tools for diligence and integration, reflecting emerging trends like multiple arbitrage and sector-specific rollups.
For hands-on practice, explore VCII's SuperSim simulator at www.vciinstitute.com to test rollup scenarios in real-time.
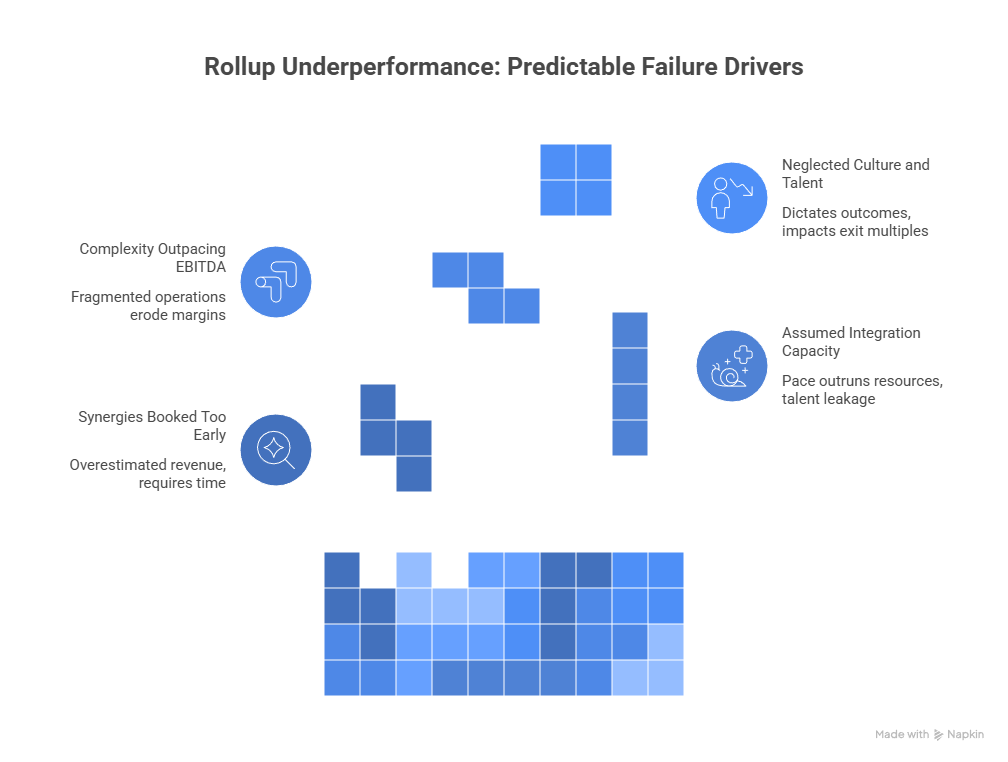
The Base Rate Reality: Data-Backed Insights
Most rollups underperform due to predictable issues, with 2025 data indicating that only high-quality platforms with clear integration roadmaps achieve outsized returns through multiple arbitrage—acquiring smaller assets at lower multiples and exiting at premiums. Key failure drivers include:
- Synergies Booked Too Early: Models often overestimate revenue synergies, which require incentives and time; cost synergies prove most reliable, capturing 70-80% of planned value in successful cases.
- Assumed Integration Capacity: Without built systems, pace outruns resources, leading to talent leakage.
- Complexity Outpacing EBITDA: Fragmented operations erode margins, with system sprawl a common drag.
- Neglected Culture and Talent: Treated as secondary until they dictate outcomes, with top-talent retention correlating to 15-20% higher exit multiples.
Using VCII's SuperSim, professionals can model these dynamics, allocating resources across the "Fruitful Five" levers to observe EBITDA impacts in simulated quarters.
The Rollup Readiness Gate: Enhanced with VCII Lens
Before accelerating acquisitions, platforms must pass a VCII-aligned readiness gate. This scorecard, scored 0-5 per dimension, now incorporates VCII Professional Assessment metrics for eight categories (e.g., Value Creation, Strategy), providing a radar chart of strengths via a 25-35 minute scenario-based evaluation at www.vciinstitute.com.
| Dimension | What “Ready” Looks Like | Red Flag | VCII Lens Integration |
|---|---|---|---|
| Management Bandwidth | Clear owners for integration + BAU; successors identified | Same leaders juggling both | Assess via Leadership Alpha module; score successors' readiness |
| Operating Cadence | Weekly KPI rhythm, clean reporting with AI dashboards | Monthly fog and surprises | Link to Live KPI feedback in SuperSim; benchmark against PE norms |
| Systems | One scalable ERP/CRM plan, including AI integration | “We will decide later” | Evaluate tech stack via Operating Partner category |
| Pricing Discipline | Documented logic with dynamic AI-optimized models | Local pricing chaos | Tie to Strategy assessment for market expansion levers |
| Talent Bench | Successors for key roles; retention plans | Single points of failure | Use TVC certification tools for talent mapping |
| Customer Concentration | Top customers stable; churn prevention via analytics | Defection risk underplayed | Incorporate Customer Health metrics from Value Creation Index |
| Digital Readiness (New) | AI tools for predictive analytics; data separation for rollups | Legacy systems without roadmap | VCII SuperSim DIP Rounds for tech synergy simulation |
Decision Rule: If any two dimensions score ≤2, pause acquisitions. VCII's free PDF report post-assessment guides remediation.
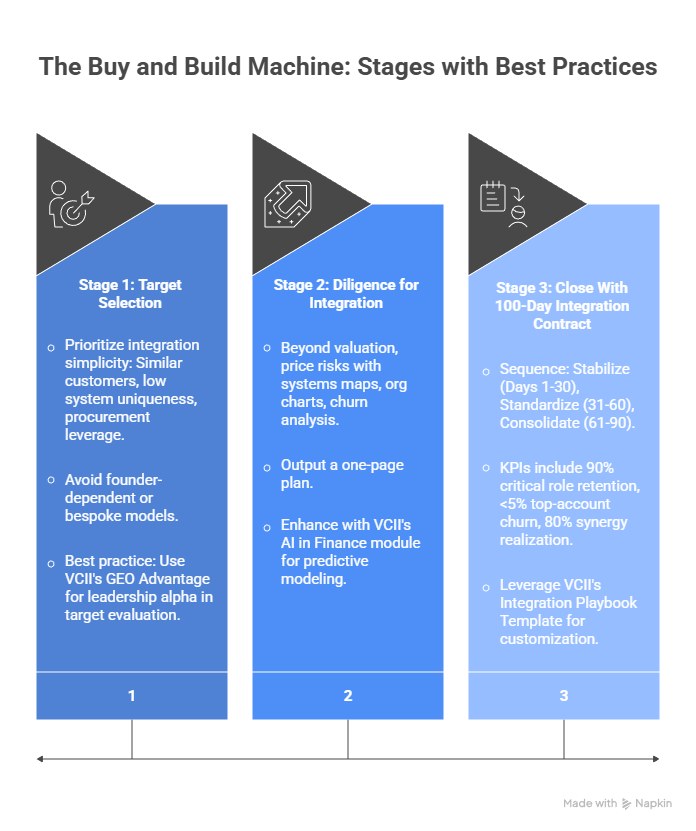
The Buy and Build Machine: Stages with Best Practices
High-performing rollups operate like manufacturing lines, with repeatable stages informed by 2025 trends such as AI in diligence and sector specialization (e.g., veterinary services like IVC Evidensia executing 300+ add-ons annually).
Stage 1: Target Selection
Prioritize integration simplicity: Similar customers, low system uniqueness, procurement leverage. Avoid founder-dependent or bespoke models. Best practice: Use VCII's GEO Advantage for leadership alpha in target evaluation.
Stage 2: Diligence for Integration
Beyond valuation, price risks with systems maps, org charts, churn analysis. Output a one-page plan. Enhance with VCII's AI in Finance module for predictive modeling.
Stage 3: Close With 100-Day Integration Contract
Sequence: Stabilize (Days 1-30), Standardize (31-60), Consolidate (61-90). KPIs include 90% critical role retention, <5% top-account churn, 80% synergy realization. Leverage VCII's Integration Playbook Template for customization.
Synergy Truth: Buckets and VCII Optimization
- Cost Synergies: Reliable via shared services; aim for 10-15% EBITDA uplift.
- Capability Synergies: Underestimated; use VCII courses for playbook upgrades.
- Revenue Synergies: Treat as upside; require enablement.
Rule: Base models on cost/capability; revenue as bonus. VCII's Value Creation Plan guides synergy tracking.
The Five Failure Modes: Mitigation Strategies
Address pace overload, systems sprawl, talent exits, customer disruption, organic slowdown with VCII's radar assessments. 2025 data shows high-quality platforms mitigate these, achieving 19% deal value growth.
Metrics That Predict Outcomes
Track via VCII dashboards:
| Category | Metric | Why It Matters | 2025 Benchmark |
|---|---|---|---|
| Growth Quality | Organic growth rate post-close | Detects masking | >5% sustained |
| Retention | Top-talent retention | Prevents collapse | 85-90% |
| Customer Stability | Churn in top accounts | Protects base | <3% |
| Integration Speed | Time to one reporting pack | Measures control | <60 days |
| Synergies | % realized vs plan | Execution gap | 75-85% |
| Complexity | System count variance | Predicts drag | <5 unique systems |
| Digital Leverage (New) | AI adoption rate | Drives efficiency | 70% in ops |
A Cleaner Decision Framework
Accelerate on hit milestones; pause on churn rises; stop on complexity stacking. Align with VCII's APEX program for exit readiness.
Bottom Line and VCII Call to Action
Buy and build is an operating system: Choose simplifying targets, integrate repeatably, protect growth. VCII equips you via certifications and tools at www.vciinstitute.com to institutionalize these practices, turning strategies into resilient value creation.
Key Citations
- EY Private Equity Pulse Q3 2025
- Bain Private Equity Outlook 2025
- McKinsey Global Private Markets Report 2025
- SourceCo Buy and Build Strategy 2025
- Ropes & Gray U.S. PE Market Recap September 2025
- PwC Next in Private Equity Trends 2025
- DealRoom Private Equity Roll-Up Strategy 2025
- FTI Consulting 2025 Private Equity Value Creation Index
- HRBench Value Creation Plan in Private Equity
- Umbrex Successful Roll-Ups Best Practices
- Allegrow Private Equity Roll Up Strategy
- Proactive Management Data Strategy for PE Rollups
- A Simple Model Private Equity Roll-Up Strategy
- Consero Global The Art of the Roll-Up
- Core Catalysts Roll-Ups Lessons for Private Equity
- Umbrex Integration Playbook Template
- VCI Institute
We have many great affordable courses waiting for you!
Stay connected with news and updates!
Join our mailing list to receive the latest news and updates from our team.
Don't worry, your information will not be shared.
We hate SPAM. We will never sell your information, for any reason.