The Pricing Flywheel: A 90 Day Playbook for Cash First Growth
Oct 24, 2025
Cost to Serve is the part of the P and L that does not talk loudly. It hides in warehouse touches, partial pallets, support tickets, and last mile stops. Two accounts with identical revenue often produce very different economics once you load service and complexity. This article shows how to build a transparent Cost to Serve model, find 300 basis points of margin, and convert policy changes into lasting gains that a buyer will trust.
Why This Matters Now
-
Inflation and mix changes have pushed margin noise into every industry.
-
Cutting SG and A creates fatigue and talent risk.
-
CTS targets waste at the root while preserving growth engines and culture.
What Cost to Serve Is
Cost to Serve allocates the true cost of fulfilling demand to the unit of one: customer x product x channel x order profile. It is not a blunt overhead spread. It is a driver based map that operators trust and can act on.
Data Sources and Drivers
-
Fulfillment: pick lines, touches, pallets, packaging type, returns.
-
Transport: stops per route, distance, dwell time, accessorials.
-
Service: ticket count, handle time, severity mix, on site visits.
-
Commercial: order size, order frequency, rush flags, cancellations.
-
Complexity: customization steps, engineering time, compliance requirements.
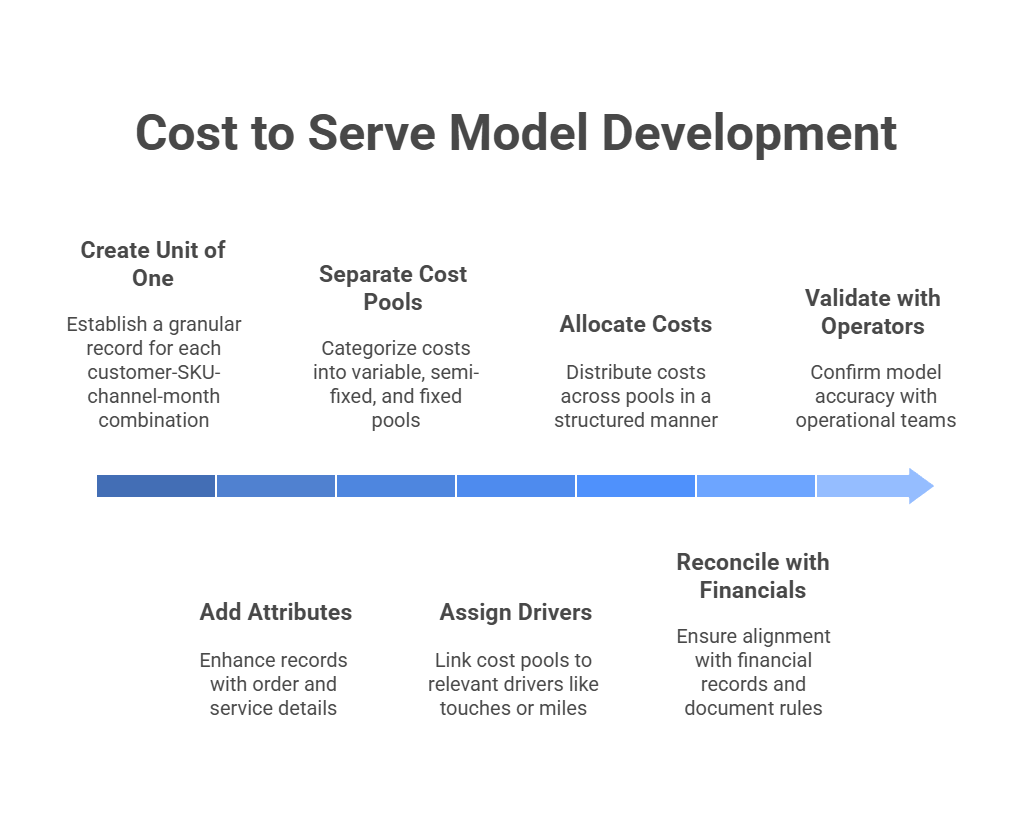
Build the Model in Four Steps
-
Unit of One
-
Create a grain at customer x SKU x channel x month.
-
Add order and service attributes to each record.
-
-
Cost Pools and Drivers
-
Separate variable, semi fixed, and fixed cost pools.
-
Assign drivers such as touches, pick lines, tickets, miles, stops, minutes.
-
-
Allocation and Reconciliation
-
Allocate variable first, then semi fixed, then fixed.
-
Reconcile to the financials and document rules in plain language.
-
-
Validation with Operators
-
Sit with warehouse leads, drivers, and support teams.
-
Check for face validity and adjust where the math misses reality.
-
Reveal and Rank
-
Rank customers by contribution margin minus Cost to Serve to get to Customer Profit.
-
Rank SKUs by velocity and complexity to expose long tail drag.
-
Build deciles and study the bottom decile accounts and SKUs.
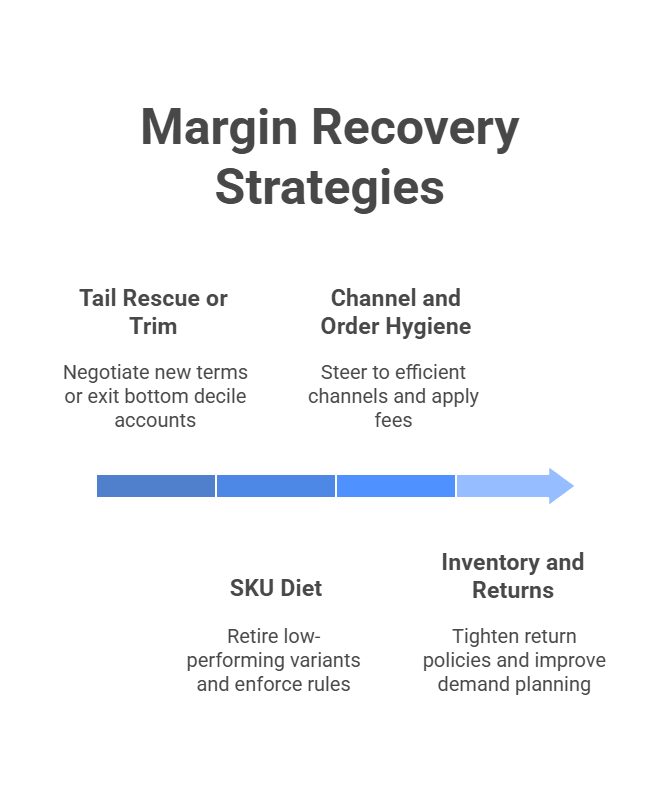
Four Moves That Recover Margin
-
Tail Rescue or Trim
-
Negotiate new service terms or reset price for the bottom decile.
-
If a rescue plan fails, exit the account.
-
-
SKU Diet
-
Retire low velocity, low margin variants.
-
Enforce case pack minimums and lead time rules.
-
-
Channel and Order Hygiene
-
Steer to self service, full case, and scheduled delivery windows.
-
Apply a rush fee or a small order fee that reflects real handling cost.
-
-
Inventory and Returns
-
Tighten RMA rules, shorten return windows, and apply refurb or disposal fees where fair.
-
Improve demand planning for the long tail to reduce partial picks.
-
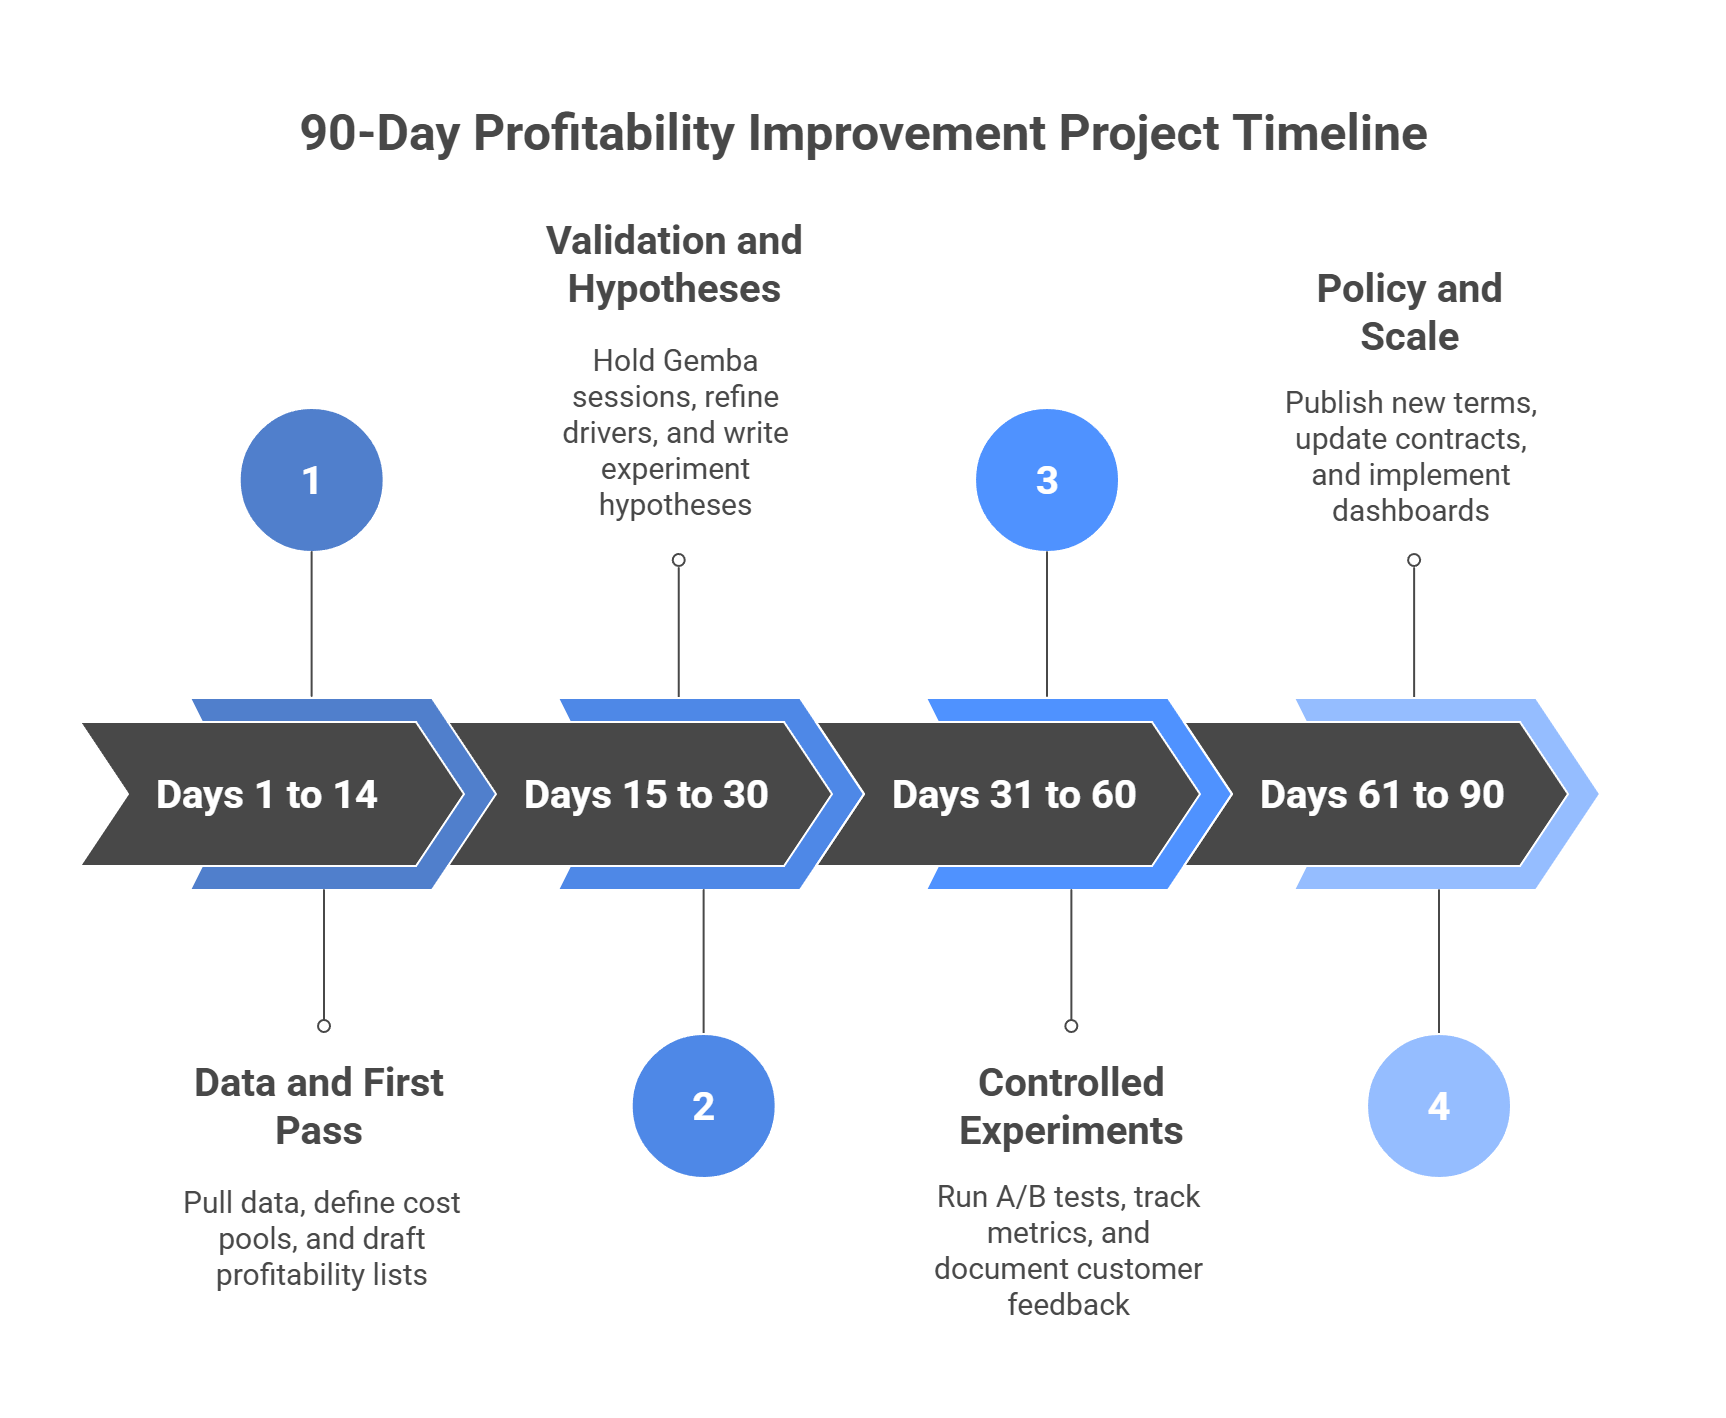
90 Day Execution Plan
Days 1 to 14: Data and First Pass
-
Pull 12 months of shipments, returns, tickets, and routes.
-
Define cost pools from the ledger.
-
Build a first pass allocation with clear driver notes.
-
Deliverable: draft customer and SKU profitability lists.
Days 15 to 30: Validation and Hypotheses
-
Hold Gemba sessions with warehouse and service teams.
-
Refine drivers and unit costs.
-
Write three hypotheses for quick experiments such as full case minimum, rush fee, or scheduled delivery discount.
Days 31 to 60: Controlled Experiments
-
Run A B tests in two regions and one channel.
-
Track conversion, order size, margin, and complaint rates.
-
Document customer messaging and objection patterns.
Days 61 to 90: Policy and Scale
-
Publish and enforce new terms.
-
Update contracts and partner agreements.
-
Put CTS dashboards in Sales and Ops weekly huddles.
-
Lock an exception path with reason codes and expiry dates.
Metrics and Targets
-
Gross margin by customer decile
-
Contribution margin by SKU family
-
Cost per stop, cost per ticket, cost per pick line
-
Percent of orders at or above MOQ or full case
-
On time in full with new terms
-
Complaint rates after policy change
Organization and Incentives
-
Shift sales compensation toward contribution margin.
-
Make exception approvals visible and time bound.
-
Recognize teams for complexity reduction wins.
Sample Tables
Customer Profit Snapshot
| Rank | Customer | Net Revenue | Variable Cost | Cost to Serve | Customer Profit | Action |
|---|---|---|---|---|---|---|
| 1 | Alpha Industrial | 12,500,000 | 8,125,000 | 1,625,000 | 2,750,000 | Protect and grow |
| 8 | Delta Retail | 7,200,000 | 4,968,000 | 1,944,000 | 288,000 | Terms reset |
| 10 | Zeta Long Tail | 2,400,000 | 1,728,000 | 1,056,000 | -384,000 | Exit or reprice |
Policy Change Impact
| Move | Metric Before | Metric After | Lift |
|---|---|---:|---:|---:|
| Full case minimum | Cost per order 58 | 44 | 24 percent improvement |
| Rush fee | Percent rush orders 19 percent | 8 percent | 11 points reduction |
| SKU diet 75 items | Avg pick lines per order 7.4 | 5.6 | 24 percent improvement |
Risks and Mitigations
-
Customer pushback: pair pricing with service level improvements and clear communication.
-
Sales resistance: update compensation and provide a one page talk track.
-
Data quality: reconcile monthly and make driver assumptions explicit.
-
Over allocation to fixed: review mix quarterly and keep fixed honest.
Exit Back Design
Package the CTS model, the policy changes, and the before after evidence. Buyers will test whether margins are a study or a system. Show that routines, dashboards, and incentives lock in the gains.
VCII Note and Copyright
VCII’s TVC Next integrates analytics with operator routines. Cost to Serve is not a one off diagnostic. It is a weekly habit that protects margin without blunt cuts.
Copyright © 2025 VCII, Meritrium Corp. All rights reserved.
We have many great affordable courses waiting for you!
Stay connected with news and updates!
Join our mailing list to receive the latest news and updates from our team.
Don't worry, your information will not be shared.
We hate SPAM. We will never sell your information, for any reason.