
The Single Source of Truth Audit: Data Hygiene Before Dashboards
Jul 06, 2026
Walk into any mid-market portfolio company on a Monday morning, ask three different functions for the same number, and you will receive three different answers.
Sales will tell you that the company has a certain customer count. Finance will offer a different one. Operations will provide a third. Each function is using its own definition, its own system, and its own counting logic. None of them is technically wrong. None of them produces the same answer. The CFO, when pressed, will acknowledge that the numbers are not reconciled and propose to clean them up after month end. Month end never quite arrives.
The short answer
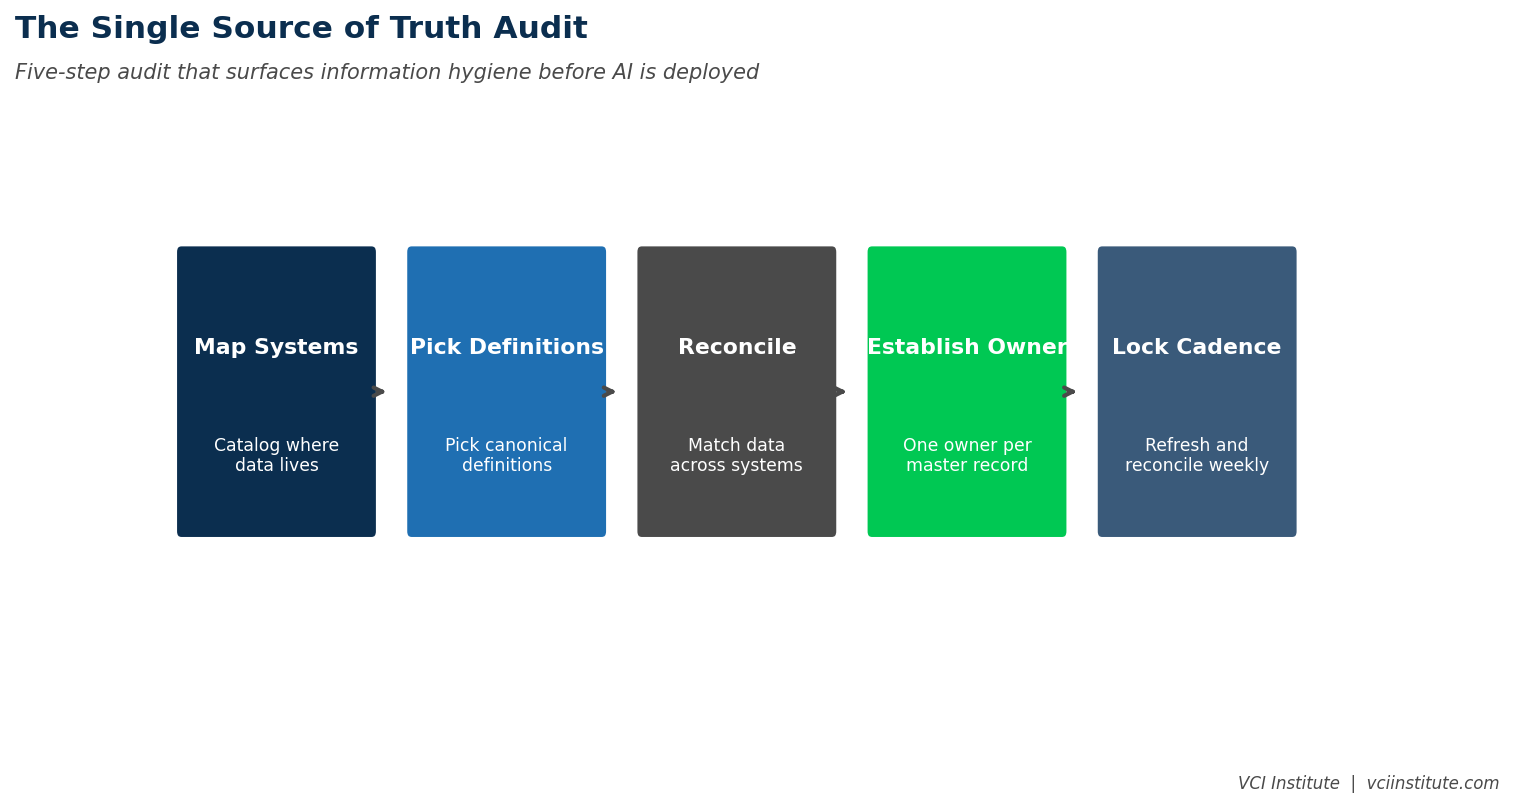
A Single Source of Truth Audit names every number that matters, locates every place it is calculated, surfaces the differences in logic, and forces a decision about which definition is canonical. Most businesses have fifteen to twenty five such numbers. The audit runs four to eight weeks. It is not a technology project, it is an alignment project, and the output is a signed set of master definitions rather than a system. The correct sequence is audit, reconcile, build canonical reporting, then add analytics or AI. Most portfolios are running steps three and four without one and two, which buys faster confusion at greater cost.
This is the data integrity gap that sits underneath almost every dashboard, every board pack, every investor report, and every value creation plan in mid-market private equity. It is also the gap that almost no operating partner audits explicitly before approving the next analytics or BI investment.
The result is predictable. Sponsors fund dashboards that present the same incoherence in better looking format. Boards spend meetings debating which version of a metric is correct rather than what to do about the metric. Investor reports include footnotes explaining definitional differences across portfolio companies. The investment in visualization runs ahead of the investment in the data the visualization is meant to display.
A Single Source of Truth Audit is the unglamorous work that has to come first. It is not a technology project. It is an alignment project. The audit identifies, by name, every important number used to run the business, locates every place that number is calculated, surfaces the differences in calculation logic, and forces a decision about which definition is canonical going forward. The audit takes between four and eight weeks. It produces, by the end, a set of master definitions that allow the company to operate from a coherent set of facts. Without it, every dashboard built afterward inherits the underlying incoherence.
The Numbers That Matter Most
The audit does not need to cover every number in the business. Most companies have between fifteen and twenty five numbers that genuinely matter, in the sense that they show up in management decisions, board meetings, or investor reporting. The audit focuses on those.
The list is usually similar across mid-market businesses. Customer count. Active customer count. Revenue. Recurring revenue. Average contract value. Pipeline. Qualified pipeline. Conversion rate. Churn rate. Net revenue retention. Gross margin. Operating expense by function. Headcount. Capacity utilization. Cash position. Working capital. Days sales outstanding. Days payable outstanding. Inventory turns. Customer acquisition cost. Lifetime value. Pipeline coverage. Win rate.
For each number, the audit asks three questions. What is the canonical definition. Where is the number calculated. Who is responsible for the calculation. The answers, written down for all twenty five numbers, produce a document that often surprises the management team. Many of the numbers turn out to have multiple definitions in active use. Several turn out to be calculated by individual analysts in spreadsheets that nobody else has access to. A few turn out to be inherited from a system that no longer reflects how the business is run.
This document is the foundation. The next phase of the audit reconciles the differences and produces a single canonical definition for each number, agreed across functions, signed off by the CFO and the COO, and committed to writing.
How the Differences Hide
The differences between functional definitions hide because each function has internal coherence. Sales does not lie when it says the company has eight hundred customers. Sales is using a CRM definition that includes any account with an active opportunity in the past twelve months. Finance does not lie when it says the company has six hundred customers. Finance is using a billing definition that includes any account with a paid invoice in the past quarter. Operations does not lie when it says the company has seven hundred fifty customers. Operations is using a service definition that includes any account currently consuming the product.
All three definitions are internally consistent. All three are used in their respective functions for legitimate operating purposes. The problem is that the management team, the board, and the sponsor sometimes use the term customer count without specifying which version they mean, and decisions get made on the basis of a number that is not the right number for the question being asked.
The audit does not require eliminating these definitional differences. Some are useful. The fix is to name the difference explicitly. Customer count, in the canonical sense, will mean billed customers in the past quarter. Sales will continue to track active CRM customers but will report this as opportunity coverage rather than as customer count. Operations will continue to track active service customers but will report this as service load. The vocabulary becomes precise. The board pack uses canonical terms. The decisions are made against numbers that mean what everyone thinks they mean.
This matters more than it sounds, because definitional ambiguity is also where diligence findings hide. A concentration number that means one thing in the CIM and another in the billing system is the mechanism described in customer concentration theatre.
The Reconciliation Discipline
The reconciliation step is where the audit produces real operating change. For each canonical number, the team has to identify the systems that produce it, the calculations that derive it, and any human intervention that adjusts it. The goal is to be able to trace the canonical number back to source data without ambiguity.
In practice, this exposes the patches that have accumulated over years. A revenue number that is calculated in the financial system and then adjusted by the sales operations team for deferred revenue effects. A churn calculation that is run from the CRM but uses a custom export the sales analyst maintains in a spreadsheet. A working capital metric that is built from three separate system pulls and then reconciled by hand on the last Friday of each month.
Each patch represents a fragility in the data integrity of the business. Each patch can break. Each patch depends on a specific person continuing to do the patch work, with no documentation, in a way that would be invisible if that person left. That last point is not hypothetical. The people holding undocumented reconciliation logic are frequently the same people identified in a post-close talent density map, and for exactly this reason.
The reconciliation discipline replaces these patches with documented, automated calculations that produce the canonical number directly from source systems. Where the systems do not support automation, the audit identifies what would need to change to enable it. Some changes are minor configuration. Some require integration work between systems. A few require system upgrades. The audit prioritizes the changes by the importance of the affected number to running the business.
What Comes After the Audit
Once the audit is complete and the canonical definitions are in place, the company has the foundation for everything else. Dashboards built on canonical definitions display coherent information. Board reporting using canonical numbers does not require footnotes. Investor reporting reflects metrics the entire portfolio can produce consistently. AI tools that consume the data produce reliable outputs because the data is reliable. Agents in particular depend on this, since an agent acting on inconsistent data propagates the inconsistency at machine speed, which is why agentic workflows should be sequenced after the audit rather than alongside it.
The company has also acquired a discipline. The discipline is that no important number is allowed to enter management or board reporting without a documented canonical definition. New metrics are added to the canonical list as the business evolves. Old metrics are retired when they no longer reflect how decisions are being made. The discipline is, ultimately, a governance practice, not a technology one.
Sponsors that institutionalize this discipline at the portfolio level produce reporting consistency that LPs notice. Funds that can demonstrate consistent, canonical operating metrics across portfolio companies have a different conversation about marks and performance than funds that cannot. The audit, properly extended, becomes part of the firm's institutional advantage.
Why the Audit Is Skipped
Most portfolio companies skip the audit. The reasons are predictable.
The first reason is that the audit looks like overhead. It does not produce a quick win. It does not deliver a visible deliverable in the first thirty days. It generates uncomfortable conversations with department heads who are protective of their definitions. The political cost of doing it right is real, and many operating partners would rather invest the political capital somewhere with more immediate visible payoff. This is the same pressure that produces the failure pattern in the 100-day autopsy, where visible early activity substitutes for foundational work.
The second reason is that the symptoms are tolerable. The fact that customer count varies by function does not stop the business from operating. People work around the inconsistency. Reports include the numbers everyone is used to seeing. The dysfunction has been present for years and has not yet caused a visible failure. Why fix it now.
The third reason is that the BI vendor pitches sound more compelling than the audit pitch. A BI vendor offers dashboards next month. The audit offers definitional clarity in eight weeks. Most management teams choose dashboards. They get prettier reporting on the same incoherent data and discover, six months later, that the prettiness did not produce better decisions because the underlying numbers still did not agree.
The Right Sequence
The right sequence is straightforward. Audit first. Reconcile second. Build canonical reporting third. Add advanced analytics or AI fourth. Most portfolios are running steps three and four without having done one and two. The result is faster confusion at greater cost. The fix is not to abandon the technology investments. The fix is to sequence them correctly.
Operating partners who insist on this sequence find that the technology investments downstream produce dramatically better returns. The same dashboard that delivered limited value before the audit becomes powerful afterward, because the numbers it displays are finally trustworthy. The same AI tool that produced suspicious output before the audit produces credible output afterward, because the input data is consistent. This is the data quality component of the AI ceiling, and in most mid-market businesses it is the binding constraint.
The audit, in other words, is not an alternative to investment in modern reporting and analytics. It is the precondition for those investments to pay back. Skip it, and the technology absorbs capital without producing the returns its vendors promised. Do it, and the technology earns its keep.
The next time a portfolio company proposes a new dashboard project, ask one question. Have we run a Single Source of Truth Audit on the metrics this dashboard will display. If the answer is yes, fund the dashboard. If the answer is no, fund the audit first. The eight weeks spent doing it produce the data foundation on which every subsequent reporting and analytics investment will be built. Without the foundation, the investments produce visualization without insight. With it, they produce the operating clarity that good decisions actually require.
VCI Institute in collaboration with Mohamad Chahine
Published 6 July 2026
Related reading from the VCI Institute
The Information Hygiene Crisis
The broader readiness condition this audit is one component of.
The AI Ceiling
Why data quality is usually the binding constraint on AI adoption, not tooling.
The Operating Maturity Index
The wider diagnostic that tells you whether this audit is the right first move.
About the VCI Institute
The VCI Institute is a nonprofit dedicated to building practical capability and shared standards for value creation in private equity. The Institute publishes operator-grade frameworks and runs certification programs for operating partners, portfolio company CEOs, and value creation analysts, including COPPE and CVCA. Analysis published here draws on the Institute's certification curricula and on structured review of mid-market transaction patterns rather than on any single proprietary dataset. Where a figure is directional rather than measured, it is described as such.
Further material is available in the Institute's Insights library and its free resource library of templates, checklists, and case snapshots.
© 2026 VCI Institute. All rights reserved. The frameworks, terminology, and analysis presented in this article are the intellectual property of the VCI Institute. Reproduction or derivative use without written permission is prohibited. Citation with proper attribution is welcomed.
We have many great affordable courses waiting for you!
Stay connected with news and updates!
Join our mailing list to receive the latest news and updates from our team.
Don't worry, your information will not be shared.
We hate SPAM. We will never sell your information, for any reason.


 Practice private equity like a pilot trains