Customer Concentration Theatre: How Diligence Reports Disguise the Real Risk
Aug 13, 2026
Customer concentration is one of the most universally measured risk metrics in private equity diligence. Every CIM addresses it. Every diligence report includes a chart of revenue by top customer. Every IC memo notes the top ten customer concentration figure. The metric has become standard, and its standardness has become a problem.
The standard measurement is the top ten customer share of revenue. Sometimes it is the top five, sometimes the top twenty. The number gets reported, the chart gets built, and the diligence team moves on. The implicit message is that if the top ten represents less than thirty or forty percent, concentration risk is acceptable.
The short answer
Top ten customer share is the wrong unit of measurement. Real concentration sits in four places the standard metric does not see: beneficial owner, where several named customers share one parent; supply chain position, where a small account controls access to a large end market; decision maker, where one buyer procures many nominally separate accounts; and relationship dependency, where the contract renews because of a person rather than an institution. Map those four, then apply the fifty percent scenario test.
This is theatre. The standard measurement misses most of what actually matters about customer concentration risk in mid-market businesses. Operating partners who rely on it find themselves surprised by customer events that the diligence numbers should have warned them about. The pattern is consistent enough that diligent buyers should be skeptical of any concentration analysis that does not go beyond the standard view.
What the Standard Number Misses
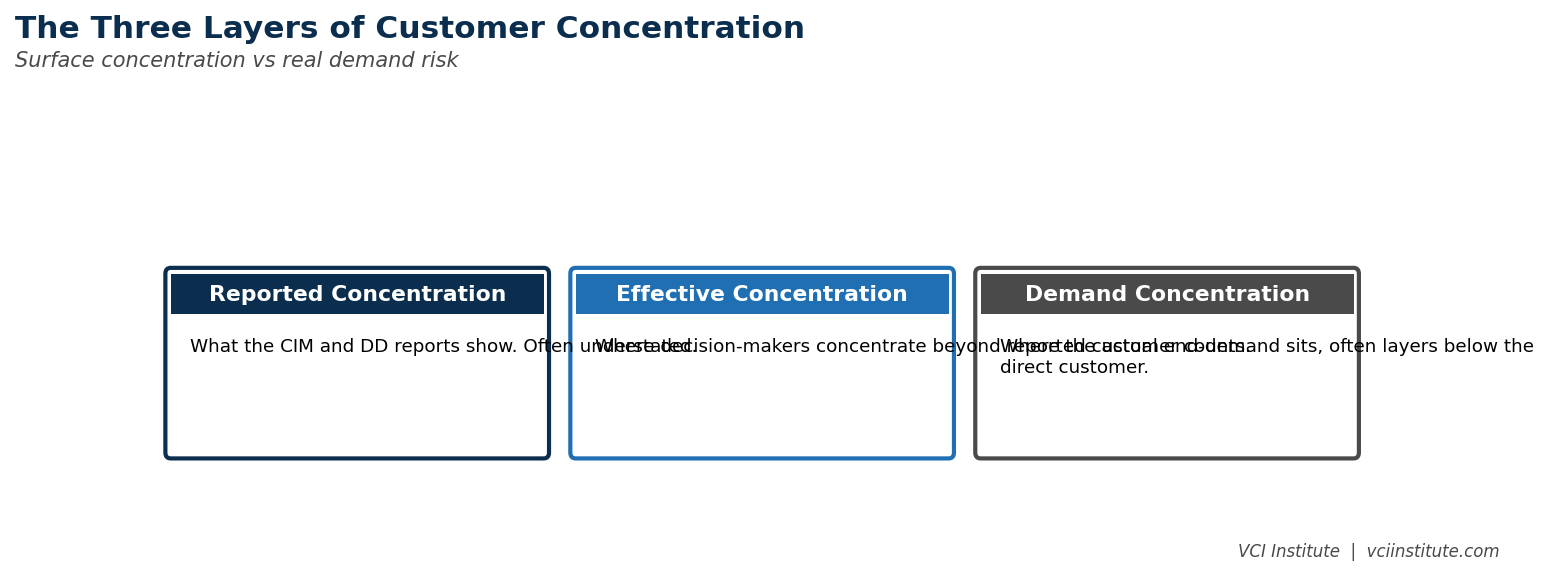
The top ten customer share captures one aspect of concentration. It misses several others, each of which can produce risks the standard view does not flag.
The first thing the standard number misses is the difference between named entity concentration and beneficial concentration. A business may have low top ten concentration measured by named customer, but high concentration measured by ultimate buyer. Three different subsidiaries of the same multinational may appear as separate customers in the data. They may share procurement decisions, contract negotiations, and relationship dynamics at the parent level. Lose the parent relationship, and three customers leave at once. The diligence report shows three percent, three percent, and three percent. The actual exposure is nine percent, controlled by a single decision maker.
The second thing it misses is supply chain concentration. Some customers have outsized importance not because of the revenue they directly produce, but because they sit at a critical point in a supply chain. A small revenue customer may be responsible for distributing the company's product to a much larger end market. Lose that customer, and the revenue accessed through them disappears. The standard concentration metric counts the small direct revenue. The actual exposure is the much larger downstream revenue that depends on the relationship.
The third thing it misses is decision maker concentration. In some businesses, particularly in B2B services and specialty manufacturing, several formally separate customers are decided by the same buyer. A consulting firm whose work for ten different clients is procured by the same Chief Procurement Officer at one private equity sponsor faces the same risk as a firm with one client. The CPO's preferences shape all ten relationships. A change in that role, or in that relationship, changes ten customer accounts simultaneously. The standard concentration metric shows ten customers. The decision concentration is one.
The fourth thing it misses is relationship dependency. Some customer relationships depend heavily on a single individual at the customer or at the company. The relationship was built personally. The contract is renewed because of the relationship rather than because of the institutional preference for the supplier. Lose the individual, on either side, and the relationship may not survive. The standard concentration metric does not distinguish between institutional and personal customer relationships, but the risk profile is very different. This is the same exposure that shows up on the people side after close, where a small number of individuals hold relationships the organisation assumes it owns. The post-close talent density map and the customer concentration map often name the same people.
How Sellers Disguise Concentration
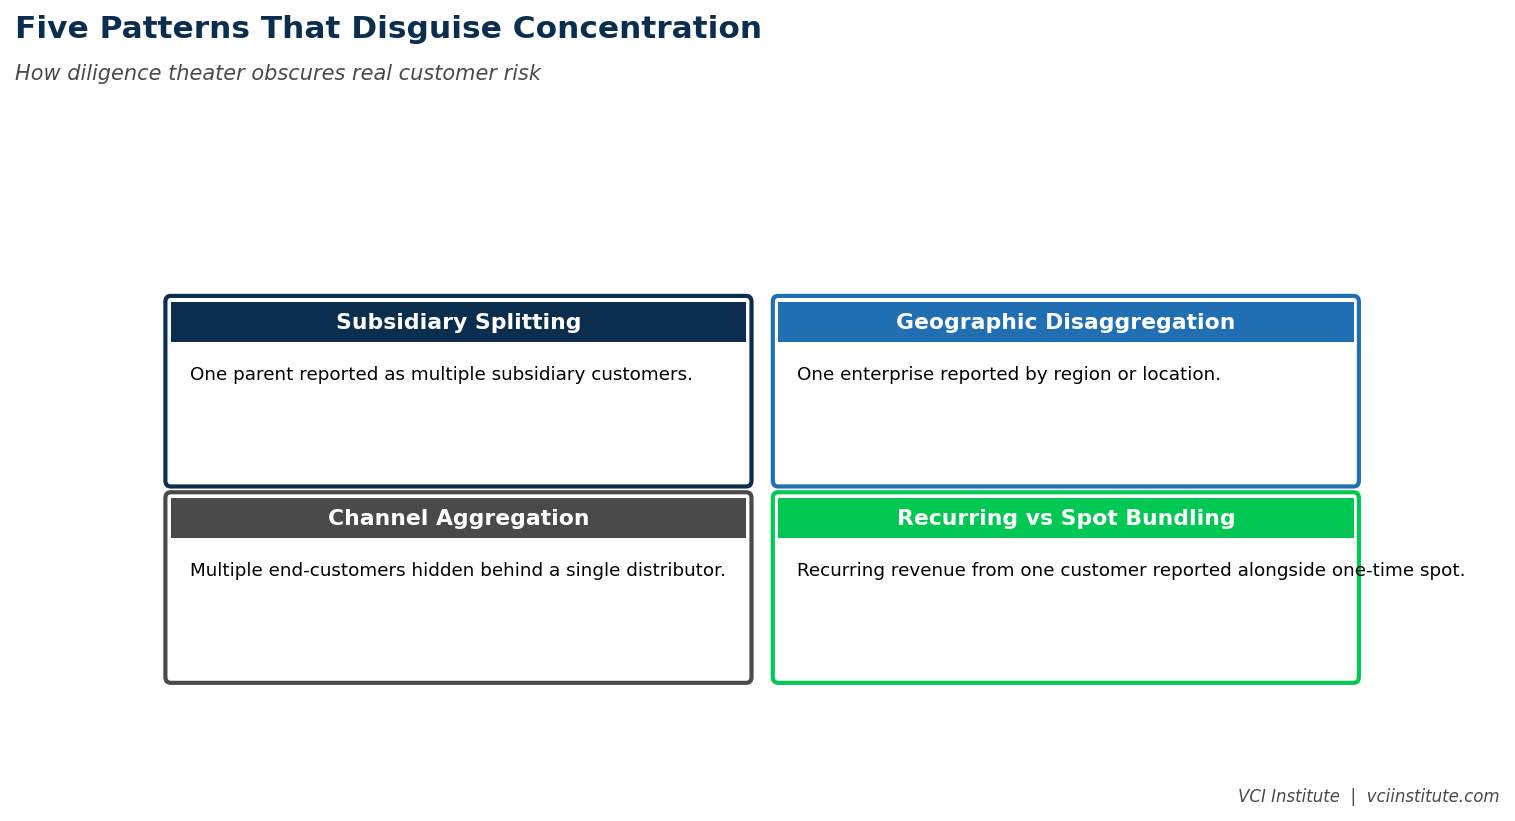
When sellers know that customer concentration will be a focus of buyer scrutiny, they have several mechanisms to shape how it appears in the data. None of these are dishonest in the strict sense, which is precisely why reading the CIM between the lines is a distinct skill from reading it carefully.
The first mechanism is to define customer at the level that produces the most favorable concentration optics. Definitions can be at the legal entity level, the operating unit level, the brand level, or the parent level. Some definitions produce reassuring top ten percentages. Others reveal the underlying concentration. Sellers naturally choose the definition that supports the favorable interpretation. Buyers should ask which definition is being used and request alternative views.
The second mechanism is to time disclosures to avoid showing recent customer changes. Concentration analysis presented as of the most recent period may not show that a major customer has been shifting business away over the past year. Trend data over twelve or twenty four months would reveal the dynamic. Point in time data does not. Diligence reports that present only current state concentration without historical trend lines are leaving important information out.
The third mechanism is to present growth narratives that obscure dependency on concentrated customers. The business is growing thirty percent. The growth narrative is compelling. The investigation reveals that growth is concentrated in two large customer relationships, with the broader customer base growing at low single digits. The standard concentration metric shows acceptable percentages. The growth quality reveals that the apparent strength is dependent on the same concentration that the percentage calculation does not flag.
The fourth mechanism is to bury contract structure information that reveals weakness. Customer contracts may be terminable on short notice. Volume commitments may be nominal rather than binding. Pricing may be subject to renegotiation. Each of these structural features increases the risk associated with any given customer relationship. Standard concentration analysis does not distinguish between contractually committed revenue and revenue that could disappear with a phone call.
What Buyers Should Actually Investigate
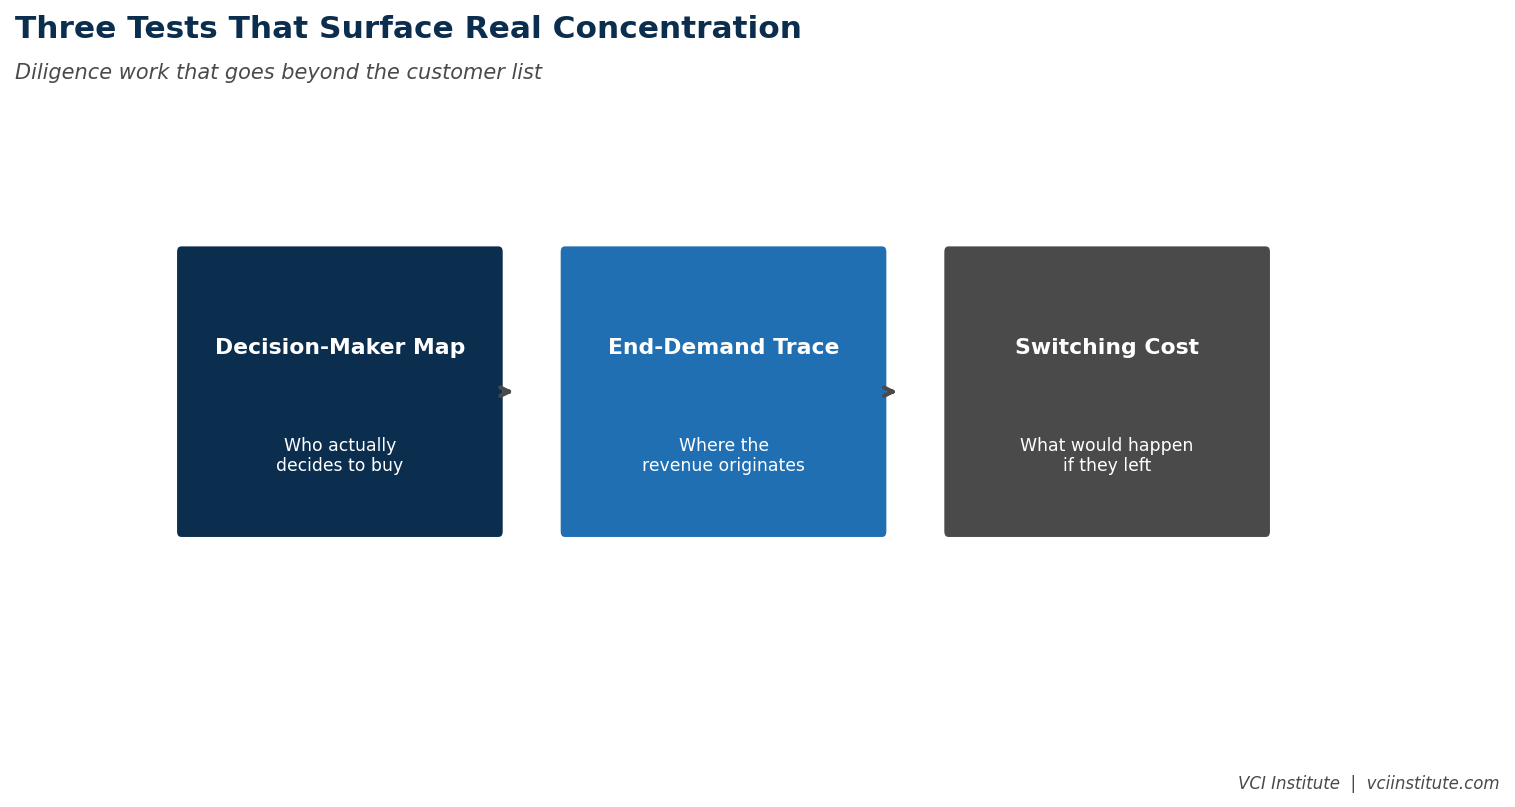
The disciplines that produce a real concentration risk assessment go beyond the standard report. Five investigations are particularly productive.
The first is the beneficial owner mapping. For each major customer, what is the ultimate parent. Are there other named customers that share the same parent. What aggregate share of revenue is exposed to each parent level decision. The mapping often reveals concentrations that the named customer view masks. Where the mapping reveals significant parent level concentration, the investigation should continue into the relationship dynamics at the parent level.
The second is the contract structure analysis. For each major customer, what is the contractual basis of the relationship. Termination provisions, volume commitments, pricing protections, exclusivity, and renewal mechanics each affect the durability of the revenue. Customers with auto-renewing multi-year contracts and minimum volume commitments are categorically different from customers on rolling agreements with no commitments. The standard concentration analysis treats them identically.
The third is the relationship dependency examination. Who manages each major customer relationship. How long has the manager been in the role. What is the depth of relationship beyond a single point of contact. Where there are deep institutional relationships across multiple touchpoints, the relationship is more durable. Where there is a single touchpoint who personally maintains the relationship, the dependency is concentrated in that individual.
The fourth is the customer trajectory analysis. For each major customer, what is the trend of business over the past twenty four months. Growing customers are usually durable customers. Stable customers are reasonably durable. Declining customers are at risk of further decline regardless of contract status. The trajectory analysis sometimes reveals that the most concentrated customers are also the ones most actively reducing their business with the company. This work is only as good as the underlying data, and in most mid-market companies the customer master is exactly where the single source of truth problem is worst.
The fifth is the customer reference investigation. Direct conversations with major customers, conducted through references rather than through the standard sell side reference process. The conversations explore satisfaction, future intentions, alternatives being considered, and the relationship dynamics that determine whether the business will continue. Reference conversations conducted by buyers directly, rather than mediated through the sell side, surface information that the standard process suppresses.
The Test Worth Applying
A useful test for any concentration analysis is to ask, what would happen if the largest five customers, defined by beneficial owner, all decided over the next twelve months to reduce their business by fifty percent. The scenario is extreme but not impossible. It tests the resilience of the business to a serious adverse outcome in its concentrated relationships.
Most businesses that pass the standard concentration test fail this scenario test. The revenue loss would be material. The cost structure would not adjust quickly enough. The remaining customer base would not absorb the lost capacity. The business would experience meaningful operational disruption.
This does not mean the business should not be acquired. It means that the concentration risk is real, the underwriting case should reflect it, and the value creation plan should include initiatives to broaden the customer base. Buyers who acknowledge this explicitly produce better outcomes than buyers who treat the standard concentration metric as the answer to the concentration question.
The Operational Implication
When concentration risk is properly assessed, the value creation plan often shifts in ways that matter. Initiatives to develop new customer relationships become higher priority. Investments in new sales capacity, new market entry, or new product development that reduces dependency on existing customers become more attractive. The whole strategic posture of the business adapts to address what the diligence revealed.
This is the productive outcome of better concentration analysis. It is not just risk identification. It is strategic redirection toward investments that improve the business's resilience. Operating partners who lead this redirection produce more durable value creation than those who treat concentration as a check the box diligence item. Where to start depends on what the company can actually absorb, which is the question an operating maturity diagnostic is designed to answer.
The Pattern To Watch
The next time you see a diligence report that presents customer concentration as a top ten share with no further analysis, recognize what you are looking at. You are looking at theatre. The number is calculated. The chart is presented. The standard threshold is met. None of the deeper questions have been answered.
A more rigorous diligence report includes beneficial owner mapping, contract structure analysis, relationship dependency assessment, customer trajectory examination, and reference conversations. It often reveals concentration risks that the standard analysis missed. It produces a more accurate underwriting case and a value creation plan that addresses the right priorities.
Operating partners who insist on the more rigorous analysis find that their portfolio outcomes are less surprising in the customer dimension. Operating partners who accept the standard analysis find that customer events they could have anticipated produce material disappointments in returns. The difference between the two approaches is the difference between knowing what you are buying and being surprised by what you bought.
VCI Institute in collaboration with Mohamad Chahine
Published 13 August 2026
Related reading from the VCI Institute
Reading the CIM Between the Lines
What sellers are telling you in the document without ever saying it directly.
The Carve-Out Underperformance Pattern
Why buying from corporates is harder than the memo says, and which costs get understated.
Pricing Power as the First-Order Lever
The margin question most underwriting models miss, and how to test it before you own it.
About the VCI Institute
The VCI Institute is a nonprofit dedicated to building practical capability and shared standards for value creation in private equity. The Institute publishes operator-grade frameworks and runs certification programs for operating partners, portfolio company CEOs, and value creation analysts, including COPPE and CVCA. Analysis published here draws on the Institute's certification curricula and on structured review of mid-market transaction patterns rather than on any single proprietary dataset. Where a figure is directional rather than measured, it is described as such.
Further material is available in the Institute's Insights library and its free resource library of templates, checklists, and case snapshots.
© 2026 VCI Institute. All rights reserved. No part of this article may be reproduced or transmitted in any form without prior written permission of the VCI Institute.
We have many great affordable courses waiting for you!
Stay connected with news and updates!
Join our mailing list to receive the latest news and updates from our team.
Don't worry, your information will not be shared.
We hate SPAM. We will never sell your information, for any reason.


 Practice private equity like a pilot trains