The Digital EBITDA Bridge: Pricing Technology Investments Into Enterprise Value
Jun 29, 2026
The hardest conversation in any private equity investment committee is not about which technology to buy. It is about what the technology is worth.
Every IC memo gestures toward digital transformation. Every value creation plan includes a section on systems modernization, data infrastructure, and customer experience. Every operating partner has war stories about CRM rollouts and pricing engines and analytics platforms. And yet, when the question is asked plainly, what is the EBITDA contribution of this five million dollar technology investment, the room tends to go quiet.
The reason is structural. Technology investments are usually justified through a vocabulary of enablement. Better data. Better visibility. Better customer experience. Better employee productivity. Each of these phrases describes an output that does not appear on a P&L. The model has to be translated, and most translations are sloppy. The result is that technology becomes the slide everyone agrees with and nobody wants to defend in detail.
This is a real value creation problem. Not because technology is unimportant. Because when investments cannot be priced into EBITDA, they get treated as either luxuries that can be cut or as compliance items that exist outside the value creation thesis. Neither treatment captures what well executed digital programs actually deliver, which is meaningful, durable, defensible enterprise value.
The Translation Problem
The translation problem starts with the language of vendors. Vendor pitches use the vocabulary of capability. Our platform enables real time visibility, dynamic pricing optimization, automated lead routing, predictive churn analysis. The capabilities are real. The translation from capability to EBITDA is the responsibility of the buyer, not the seller, and that translation is where most projects break down.
A vendor selling a CRM upgrade does not need to prove a specific EBITDA number to close a sale. The vendor needs to prove that the platform is better than the existing system on a range of metrics that matter to functional buyers. The buyer's job is to translate those metrics into financial outcomes. In private equity, the buyer is usually the operating partner or the portfolio company CFO, and they are usually doing the translation in their head, with assumptions that have not been written down or stress tested.
This is how investments get approved with weak business cases. The vendor's deck looks compelling. The capabilities are obvious. The financial translation is implicit. Six months later, when the platform is implemented and the CFO is asked to show the EBITDA impact, the answer is a list of capabilities that were delivered and a hand wave toward future operating improvements that may or may not materialize.
The fix is to require an explicit EBITDA bridge before any technology investment is approved.
The Bridge Itself
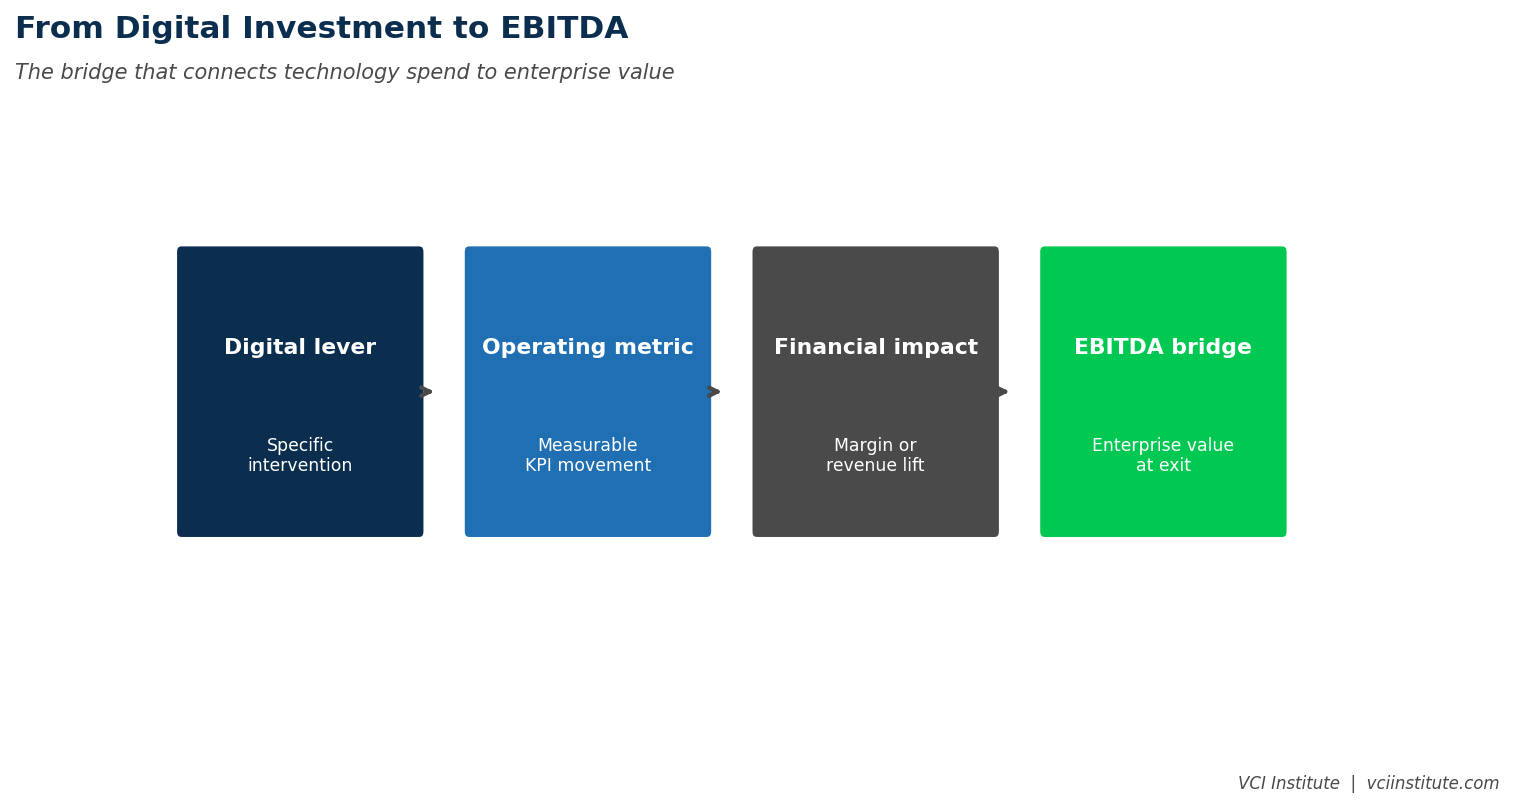
A Digital EBITDA Bridge has five layers. Each layer translates one step further from technology capability toward financial outcome.
The first layer is the capability. What does the technology actually do. A CRM platform centralizes customer data, automates routing, enables sales reporting. A pricing engine analyzes transaction history, recommends prices, exposes margin variance. A BI tool integrates data sources, surfaces dashboards, supports analysis. The capability is what the vendor sells. It is the input to the bridge, not the output.
The second layer is the operational metric. What measurable behavior changes when the capability is in place. The CRM does not directly produce revenue. It changes the speed of lead response, the conversion rate at each pipeline stage, the cross sell penetration, the churn rate. The pricing engine does not directly produce margin. It changes the realized price per transaction, the discount frequency, the price exception rate. The operational metric is the bridge between technology and business.
The third layer is the financial driver. What top line, gross margin, working capital, or operating expense category is affected by the operational metric. Revenue grows because conversion rates improved. Gross margin grows because realized prices improved. Operating expenses fall because customer service productivity improved. Working capital improves because collections processes improved. The financial driver is the line on the P&L or balance sheet that actually moves.
The fourth layer is the EBITDA contribution. The financial driver, expressed in dollars, contributes to EBITDA at a specific magnitude. A two percent improvement in gross margin on a one hundred million dollar revenue base contributes two million in EBITDA. A fifteen percent improvement in customer service productivity on a five million dollar service team cost contributes seven hundred fifty thousand in EBITDA. The math is not magic. It is arithmetic, applied honestly to the operational metrics the technology is moving.
The fifth layer is the enterprise value impact. The EBITDA contribution, applied at the exit multiple, produces an enterprise value lift. Two million of recurring EBITDA at an eight times multiple is sixteen million of enterprise value. The five million dollar technology investment that produced two million of recurring EBITDA generated a three to one return on capital, before any other consideration. This is the number that justifies the investment in the language the IC actually speaks.
What Goes Wrong in the Bridge
The bridge looks simple in the abstract. In practice, it is where most digital investments get into trouble. Three errors recur.
The first error is overstating the operational metric improvement. Vendors quote ranges from their best case clients. Operating partners apply those ranges to portfolio companies that look superficially similar but operate in different conditions. The CRM that produced a thirty percent conversion lift in a fast moving B2C business may produce only a five percent conversion lift in a slower B2B environment. The error usually shows up as the gap between the projected and actual lift, attributed to implementation issues that are really projection issues.
The second error is double counting across initiatives. The CRM is supposed to lift conversion rates. The pricing engine is supposed to lift realized prices. The BI platform is supposed to enable better commercial decisions. Each one is justified independently with a conversion or margin impact. But many of those impacts overlap. The same revenue lift may be attributed to three separate technology investments, none of which would individually deliver the full effect. When the financial outcomes are summed without adjustment, the bridge collapses under its own optimism.
The third error is failing to account for adoption. Technology delivers value only when used. A CRM that is rolled out but not used by the sales team produces no operational metric improvement, regardless of how powerful the platform is. A pricing engine that is overruled by sales reps in eighty percent of cases produces no margin lift. The bridge is not just a function of capability. It is a function of capability multiplied by adoption rate, and adoption rate is consistently the variable that operating partners underestimate.
Disciplined sponsors build adoption into the bridge explicitly. They do not assume one hundred percent adoption. They assume realistic adoption based on the change management complexity, the user training plan, and the management commitment to enforcement. A bridge that assumes seventy percent adoption produces a more honest projected EBITDA than one that assumes one hundred percent.
The Investment Hurdle
Once the bridge exists, the investment hurdle becomes straightforward. The technology investment, including software cost, implementation cost, change management cost, and ongoing operating cost over the hold period, has to produce enterprise value impact in excess of itself by a meaningful multiple. A typical hurdle is three to five times return on capital, which corresponds roughly to the equity returns the fund is targeting on its overall thesis.
A digital investment that clears this hurdle, with a credible bridge and conservative assumptions, is funded. One that does not clear it, or that requires heroic adoption assumptions, is rejected or rebuilt. The discipline is the same as any other capital allocation decision in private equity. The novelty is in applying it consistently to technology, where most firms have historically applied it only loosely.
What This Reveals
When the bridge discipline is applied consistently across a portfolio, three patterns emerge.
The first pattern is that some technology investments that everyone knew were valuable turn out to be even more valuable than they were credited for. Foundational data infrastructure investments often look expensive in the short term and unimpressive in the operational metrics they directly move. They show up as multipliers across many other initiatives, and the bridge analysis surfaces this multiplicative effect that single project business cases miss.
The second pattern is that some technology investments that everyone assumed were table stakes turn out to have weaker bridges than the funding suggested. Many ERP modernization projects fall into this category. They are presented as necessary investments that do not require a bridge because they are foundational. When a bridge is forced, the ERP often produces less direct EBITDA impact than its cost. This does not mean ERPs should not be funded. It means they should be sized to what the business genuinely requires rather than to what the vendor wants to sell.
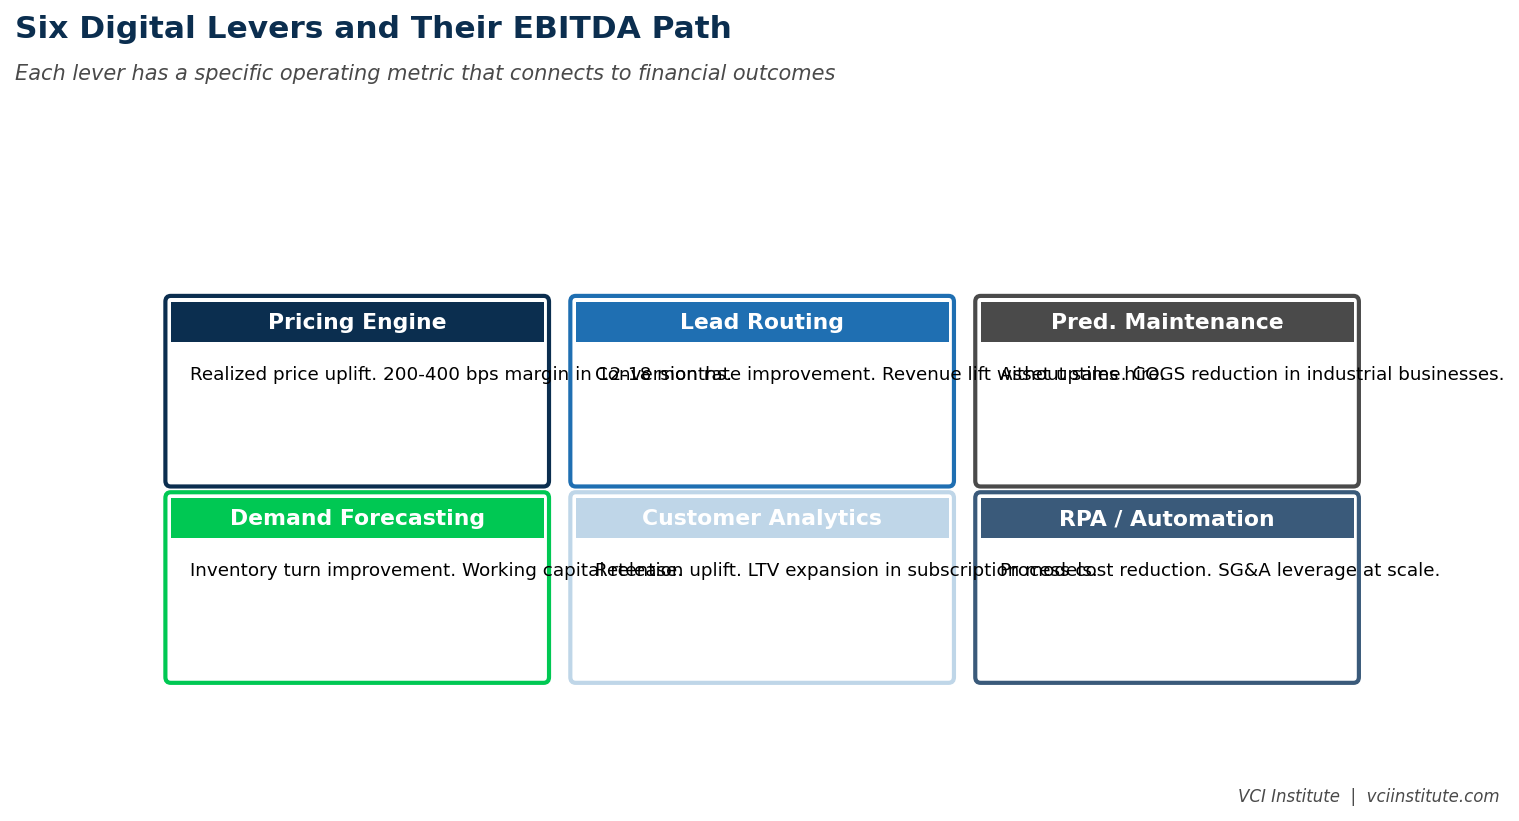
The third pattern is that the most overlooked digital investments tend to be the unglamorous ones. Speed to lead infrastructure. Master data hygiene. Reporting automation. None of these are exciting vendor pitches. All of them produce strong bridges because they directly move operational metrics that translate cleanly into financial outcomes. Operating partners who become disciplined bridge builders tend to spend more on these unglamorous investments and less on the platforms that sound transformational but bridge poorly.
The Cultural Shift
Forcing the bridge discipline produces a cultural shift inside both portfolio companies and sponsor teams. The shift is uncomfortable for management teams that are used to selling technology investments through capability narratives rather than financial models. It is uncomfortable for vendors that prefer not to be held to specific operational metric improvements. It is even uncomfortable for some sponsors who would rather wave at digital strategy than be specific about what it is supposed to deliver.
Once the discipline is established, however, the conversations change in ways that benefit everyone. Vendors learn to support the bridge with operational evidence from comparable clients. Management teams learn to size their requests to what they can credibly defend. Sponsors learn to tell the difference between technology investments that drive enterprise value and technology investments that drive comfort. Boards learn to ask the bridge question in the same way they ask about any other capital allocation decision.
This is, in the end, what mature digital value creation looks like in private equity. It is not technology evangelism. It is capital discipline applied to a category of investment that has historically resisted it. The firms that develop this discipline early will have an advantage on portfolio level value creation that their competitors are still trying to talk their way around. The firms that do not will continue to fund digital investments through narrative and discover, year by year, that the EBITDA they expected to materialize never quite did.
A Practical Question for Your Next Meeting
The next time a portfolio company brings a technology investment proposal to the board, ask one question. What is the operational metric this investment will move, by how much, and what does that translate to in EBITDA over the hold period. If the proposal answers all three parts of the question with specific numbers and defensible assumptions, fund it. If the proposal cannot answer one of the three parts, send the team back to build the bridge. The fifteen minutes spent doing this is the most leveraged due diligence a sponsor can perform on technology, and it is the only honest way to ensure that the digital portion of the value creation plan actually creates value rather than absorbing it.
About the VCI Institute
The VCI Institute is a nonprofit dedicated to building practical capability and shared standards for value creation in private equity. The Institute publishes operator-grade frameworks, runs training programs for emerging operating partners and CFOs, and operates a value creation simulator at vci.institute/simulator that lets sponsors and management teams stress test their value creation plans before committing capital. To learn more, visit vciinstitute.com.
© 2026 VCI Institute. All rights reserved. No part of this article may be reproduced or transmitted in any form without prior written permission of the VCI Institute.
We have many great affordable courses waiting for you!
Stay connected with news and updates!
Join our mailing list to receive the latest news and updates from our team.
Don't worry, your information will not be shared.
We hate SPAM. We will never sell your information, for any reason.